
题目
The times taken to travel to college by 2500 students are summarised in the table.
| Time taken ( minutes) | |||||
|---|---|---|---|---|---|
| Frequency | 440 | 720 | 920 | 300 | 120 |
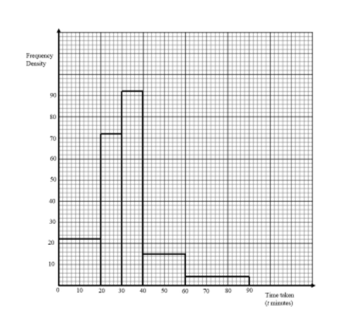
(a) Draw a histogram to represent this information.
From the data, the estimate of the mean value of is 31.44.
(b) Calculate an estimate of the standard deviation of the times taken to travel to college.
(c) In which class interval does the upper quartile lie?
It was later discovered that the times taken to travel to college by two students were incorrectly recorded. One student’s time was recorded as 15 instead of 5 and the other’s time was recorded as 65 instead of 75.
(d) Without doing any further calculations, state with a reason whether the estimate of the standard deviation in part (b) would be increased, decreased or stay the same.
题目中文翻译
2500 名学生前往学院所用的时间汇总如下表。
| 所用时间( 分钟) | |||||
|---|---|---|---|---|---|
| 频数 | 440 | 720 | 920 | 300 | 120 |
(a) 绘制直方图来表示这些信息。
根据这些数据, 的平均数估计值为 31.44。
(b) 计算前往学院所用时间的标准差估计值。
(c) 上四分位数位于哪个组区间?
后来发现,两名学生前往学院所用的时间记录有误。一名学生的时间应为 5,却被记成 15;另一名学生的时间应为 75,却被记成 65。
(d) 不进行任何进一步计算,说明 (b) 中的标准差估计值会增大、减小还是保持不变,并给出理由。
原卷通用作答要求
Answer all questions. You should use a calculator where appropriate.
You must show all necessary working clearly; no marks will be given for unsupported answers from a calculator.
Give non-exact numerical answers correct to 3 significant figures, or 1 decimal place for angles in degrees, unless a different level of accuracy is specified in the question.
请回答所有题目。适当时应使用计算器。必须清楚展示所有必要的计算过程;仅给出计算器答案而没有过程,不予评分。除非题目另有精度要求,非精确数值答案保留 3 位有效数字,以度为单位的角度保留 1 位小数。
解答
(a)
解法一
思路
展开
组距不等,柱高用频数除以组距。
答题过程
展开
| Time interval (minutes) | Class width | Frequency density |
|---|---|---|
Draw adjoining bars over these intervals with the stated heights. Label the axes “Time (minutes)” and “Frequency density”, using linear scales.
(b)
解法一
思路
展开
使用组中点10、25、35、50、75求平方和,均值直接用31.44。
答题过程
展开
The class midpoints are minutes. Hence
Using the given mean, the estimated standard deviation is
解法二
思路
展开
也可将各组中点与题给均值31.44的平方离差按频数加权,直接求出方差,再开平方。
答题过程
展开
Using the class midpoints and the given mean,
Hence the estimated standard deviation is
(c)
解法一
思路
展开
上四分位数约第1875项,前两组累计1160,前三组2080,落在第三组。
答题过程
展开
The cumulative frequencies begin . Since lies between 1160 and 2080, the upper quartile is in
(d)
解法一
思路
展开
问的是分组估计标准差,两条更正都未改变所属组,因此中点与频数完全不变。
答题过程
展开
The estimate stays the same, because each corrected time remains in its original class interval. The class frequencies and midpoints used in the grouped estimate are unchanged.