
题目
The times taken, in seconds, by 15 members of each of two swimming clubs, the Penguins and the Dolphins, to swim 50 metres are shown in the following table.
| Penguins | 35 | 39 | 42 | 44 | 45 | 45 | 48 | 50 | 56 | 58 | 59 | 61 | 66 | 68 | 72 |
|---|---|---|---|---|---|---|---|---|---|---|---|---|---|---|---|
| Dolphins | 36 | 41 | 43 | 48 | 49 | 49 | 50 | 51 | 54 | 56 | 56 | 60 | 61 | 64 | 71 |
(a) Draw a back-to-back stem-and-leaf diagram to represent this information, with Penguins on the left-hand side.
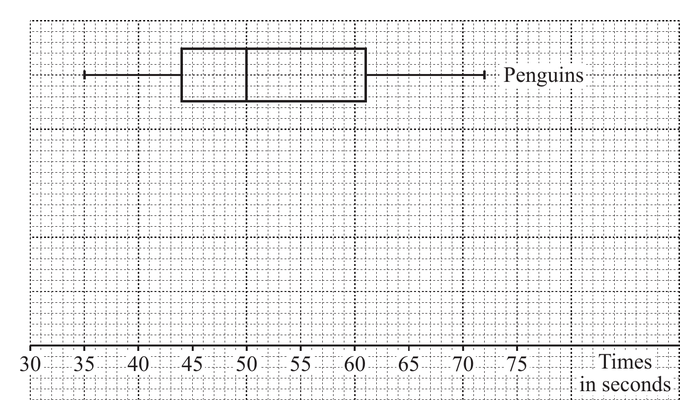
The diagram shows a box-and-whisker plot representing the times for the Penguins.
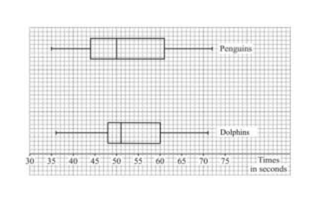
(b) On the same diagram, draw a box-and-whisker plot to represent the times for the Dolphins.
(c) Hence state one difference between the distributions of the times for the Penguins and the Dolphins.
题目中文翻译
Penguins 和 Dolphins 两个游泳俱乐部各有 15 名会员,其游完 50 米所用的时间(以秒为单位)如下表所示。
| Penguins | 35 | 39 | 42 | 44 | 45 | 45 | 48 | 50 | 56 | 58 | 59 | 61 | 66 | 68 | 72 |
|---|---|---|---|---|---|---|---|---|---|---|---|---|---|---|---|
| Dolphins | 36 | 41 | 43 | 48 | 49 | 49 | 50 | 51 | 54 | 56 | 56 | 60 | 61 | 64 | 71 |
(a) 画一幅背靠背茎叶图表示这些数据,并将 Penguins 的数据画在左侧。
图中给出了表示 Penguins 所用时间的箱线图。
(b) 在同一幅图中画出表示 Dolphins 所用时间的箱线图。
(c) 由此指出 Penguins 与 Dolphins 所用时间的分布之间的一个差异。
原卷通用作答要求
Answer all questions. You should use a calculator where appropriate.
You must show all necessary working clearly; no marks will be given for unsupported answers from a calculator.
Give non-exact numerical answers correct to 3 significant figures, or 1 decimal place for angles in degrees, unless a different level of accuracy is specified in the question.
请回答所有题目。适当时应使用计算器。必须清楚展示所有必要的计算过程;仅给出计算器答案而没有过程,不予评分。除非题目另有精度要求,非精确数值答案保留 3 位有效数字,以度为单位的角度保留 1 位小数。
解答
(a)
解法一
思路
展开
以十位为茎、个位为叶,左侧Penguins从茎向外递增,图例同时解释两侧及秒单位。
答题过程
展开
Use stems , with Penguins on the left and Dolphins on the right. Order leaves away from the stem on both sides.
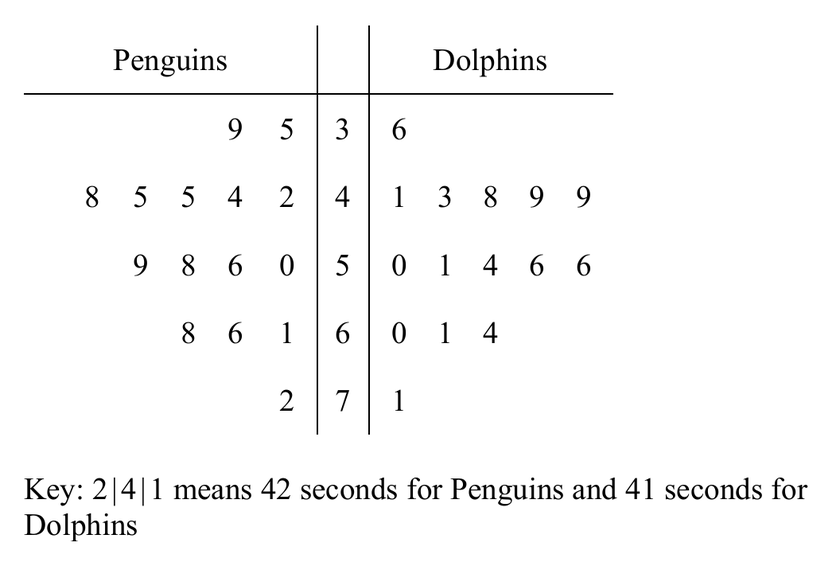
Key: means 42 seconds for Penguins and 41 seconds for Dolphins.
(b)
解法一
思路
展开
15个数据的中位数为第8个,四分位数为第4、第12个。给定Penguins箱线图保留,在同一刻度补Dolphins。
答题过程
展开
For Dolphins, the five-number summary is
On the same time scale as the Penguins plot, draw a box from 48 to 60 with a median line at 51. Draw whiskers to 36 and 71, and label it “Dolphins”.
(c)
解法一
思路
展开
由(b)比较四分位距,用具体数值支持一致性结论,只给题目要求的一个差异。
答题过程
展开
The Dolphins have more consistent swimming times: their interquartile range is seconds, compared with seconds for the Penguins.