题目
84 people attempt a particular puzzle. The times taken, in minutes, to complete the puzzle are recorded. These times are represented in the cumulative frequency graph below.
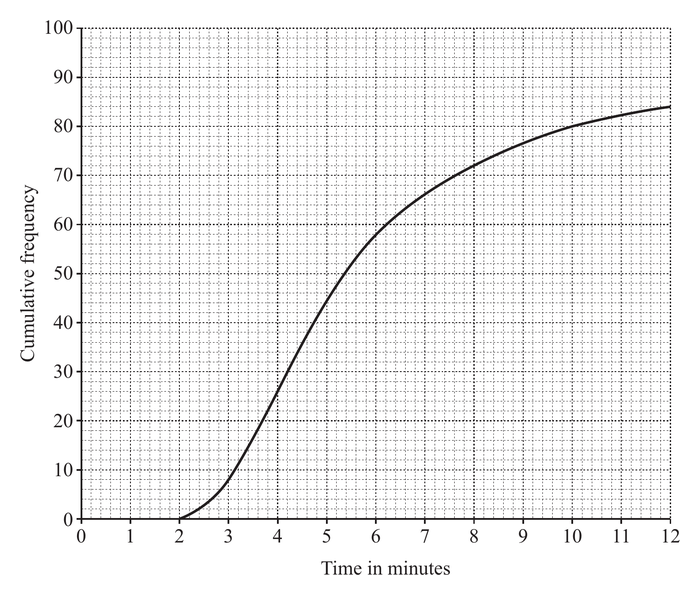
(a) Use the graph to estimate how many people took between 4 and minutes to complete the puzzle.
(b) On the grid below, draw a box-and-whisker plot to summarise the information in the cumulative frequency graph.
题目中文翻译
84 人尝试解一道谜题。记录他们完成谜题所用的时间,单位为分钟。这些用时由下方的累积频数图表示。
(a) 利用该图估计有多少人完成谜题所用的时间在 4 分钟与 分钟之间。
(b) 在下方的网格上画出箱线图,概括累积频数图中的信息。
原卷通用作答要求
Answer all questions. You should use a calculator where appropriate.
You must show all necessary working clearly; no marks will be given for unsupported answers from a calculator.
Give non-exact numerical answers correct to 3 significant figures, or 1 decimal place for angles in degrees, unless a different level of accuracy is specified in the question.
请回答所有题目。适当时应使用计算器。必须清楚展示所有必要的计算过程;仅给出计算器答案而没有过程,不予评分。除非题目另有精度要求,非精确数值答案保留 3 位有效数字,以度为单位的角度保留 1 位小数。
解答
(a)
解法一
思路
展开
累计频数差表示区间内人数,分别在4及7.5分钟处读数后相减。
答题过程
展开
Reading the graph gives cumulative frequencies of about 27 at 4 minutes and 70 at 7.5 minutes.
Thus the estimated number is .
(b)
解法一
思路
展开
84人的四分位数分别在累计频数21、42、63处读出。再从图读最小与最大时间,用五数概括画箱线图。
答题过程
展开
Read the quartiles at cumulative frequencies
A suitable five-number summary from the curve is
| Minimum | Lower quartile | Median | Upper quartile | Maximum |
|---|---|---|---|---|
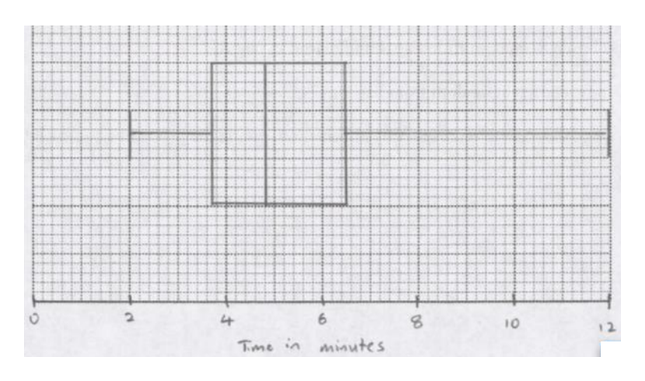
Use a linear scale labelled “Time (minutes)”, draw the box from 3.8 to 6.5 with its median at 4.8, and extend central whiskers to 2 and 12.