
题目
The Smarts and the Teasers are two quiz teams that each contain 11 members. Both complete a puzzle and the following table gives the times taken, in minutes, by the members of each team.
| Smarts | 38 | 30 | 13 | 29 | 18 | 22 | 28 | 18 | 11 | 9 | 41 |
|---|---|---|---|---|---|---|---|---|---|---|---|
| Teasers | 39 | 37 | 18 | 36 | 25 | 25 | 32 | 21 | 15 | 12 | 39 |
(a) Represent this information in a back-to-back stem-and-leaf diagram with Smarts on the left-hand side.
For the Teasers, the values of the lower quartile, median and upper quartile are 18, 25 and 37 minutes respectively.
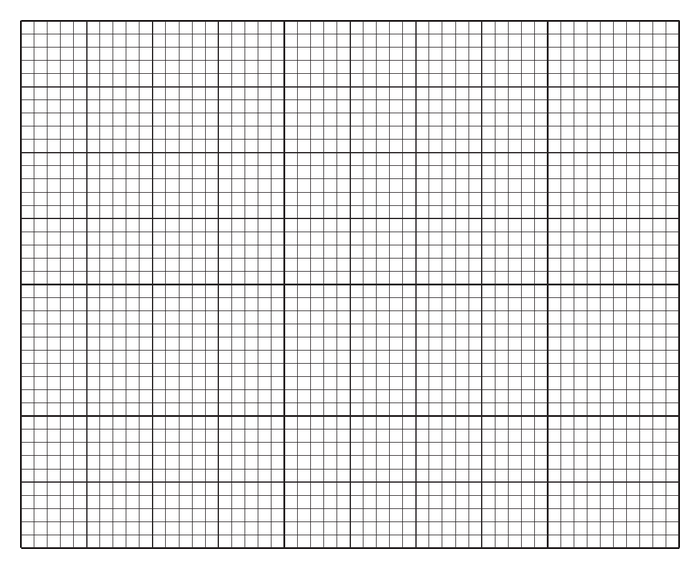
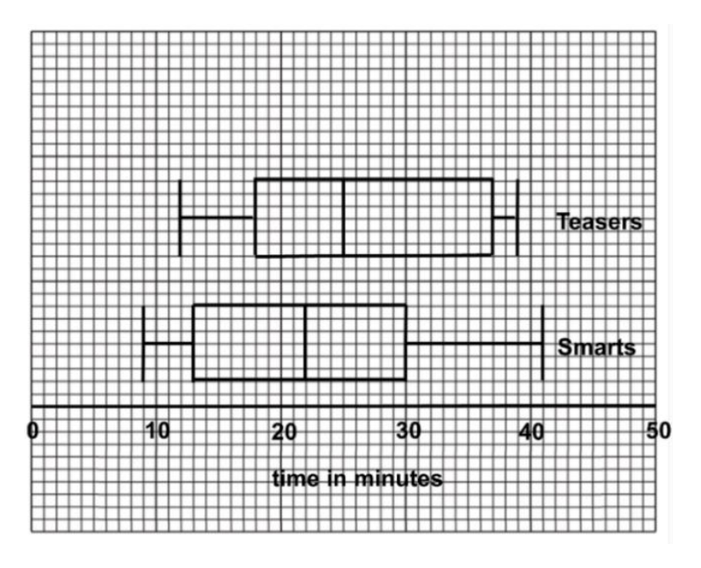
(b) On a single diagram draw box-and-whisker plots for the two teams.
(c) Make two comparisons between the times for the two teams.
题目中文翻译
Smarts 和 Teasers 是两支各有 11 名成员的智力竞赛队。两队都完成一道谜题,下表给出了各队成员所用的时间,单位为分钟。
| Smarts | 38 | 30 | 13 | 29 | 18 | 22 | 28 | 18 | 11 | 9 | 41 |
|---|---|---|---|---|---|---|---|---|---|---|---|
| Teasers | 39 | 37 | 18 | 36 | 25 | 25 | 32 | 21 | 15 | 12 | 39 |
(a) 用背靠背茎叶图表示这些信息,将 Smarts 队的数据放在左侧。
Teasers 队的下四分位数、中位数和上四分位数分别为 18、25 和 37 分钟。
(b) 在同一幅图中画出两队的箱线图。
(c) 对两队的用时作出两项比较。
原卷通用作答要求
Answer all questions. You should use a calculator where appropriate.
You must show all necessary working clearly; no marks will be given for unsupported answers from a calculator.
Give non-exact numerical answers correct to 3 significant figures, or 1 decimal place for angles in degrees, unless a different level of accuracy is specified in the question.
请回答所有题目。适当时应使用计算器。必须清楚展示所有必要的计算过程;仅给出计算器答案而没有过程,不予评分。除非题目另有精度要求,非精确数值答案保留 3 位有效数字,以度为单位的角度保留 1 位小数。
解答
(a)
解法一
思路
展开
以十位为茎、个位为叶,Smarts放左边。左侧由茎向外递增,右侧由茎向外递增,并写队名和分钟图例。
答题过程
展开
Use tens as stems and units as leaves, with Smarts on the left.
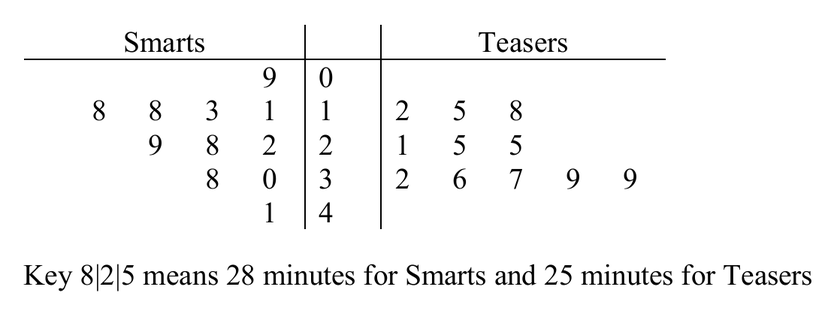
Key: means 28 minutes for Smarts and 25 minutes for Teasers.
(b)
解法一
思路
展开
先排好Smarts的11个数据,求第3、第6、第9个值作为四分位数与中位数。用两队五数概括和同一刻度画箱线图。
答题过程
展开
The ordered Smarts times are
Their lower quartile, median and upper quartile are the 3rd, 6th and 9th values: 13, 22 and 30 minutes.
Use these summaries:
| Team | Minimum | Lower quartile | Median | Upper quartile | Maximum |
|---|---|---|---|---|---|
| Smarts | |||||
| Teasers |
Draw both plots on one linear scale labelled “Time (minutes)” and identify each team.
(c)
解法一
思路
展开
分别比较典型完成时间与中间数据的离散程度。Smarts中位数较小、四分位距也较小,但总极差较大,不能混用两个离散指标。
答题过程
展开
The Smarts completed the puzzle more quickly on average: their median time is 22 minutes compared with 25 minutes for the Teasers.
The Smarts’ times are more consistent in terms of interquartile range: minutes compared with minutes for the Teasers.