
题目
The times, minutes, taken to complete a walking challenge by 250 members of a club are summarised in the table.
| Time taken ( minutes) | ||||||
|---|---|---|---|---|---|---|
| Cumulative frequency | 32 | 66 | 112 | 178 | 228 | 250 |
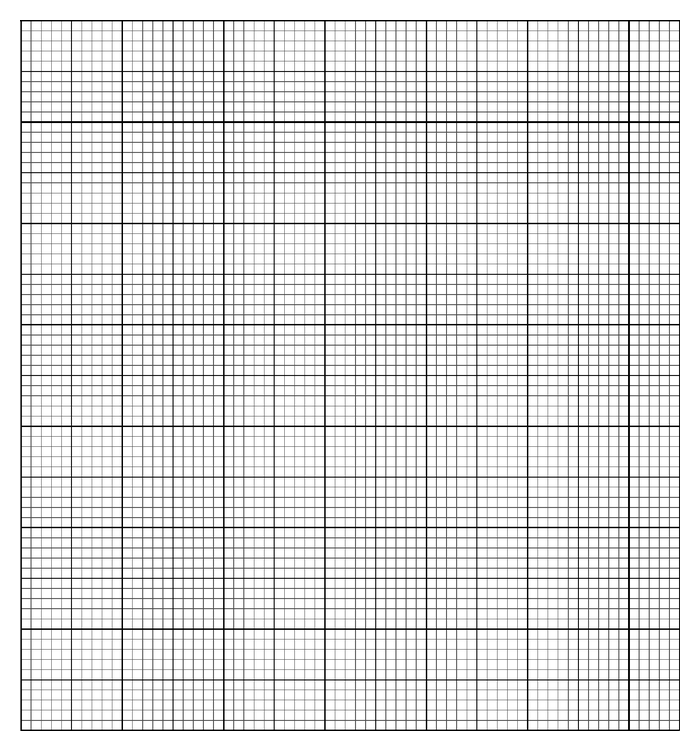
(a) Draw a cumulative frequency graph to illustrate the data.
(b) Use your graph to estimate the 60th percentile of the data.
It is given that an estimate for the mean time taken to complete the challenge by these 250 members is 34.4 minutes.
(c) Calculate an estimate for the standard deviation of the times taken to complete the challenge by these 250 members.
题目中文翻译
某俱乐部的 250 名成员完成一项步行挑战所用的时间为 分钟,汇总如下表。
| 所用时间( 分钟) | ||||||
|---|---|---|---|---|---|---|
| 累积频数 | 32 | 66 | 112 | 178 | 228 | 250 |
(a) 绘制累积频数图来表示这些数据。
(b) 利用你的图估计这些数据的第 60 百分位数。
已知这 250 名成员完成挑战所用时间的平均数估计值为 34.4 分钟。
(c) 计算这 250 名成员完成挑战所用时间的标准差估计值。
原卷通用作答要求
Answer all questions. You should use a calculator where appropriate.
You must show all necessary working clearly; no marks will be given for unsupported answers from a calculator.
Give non-exact numerical answers correct to 3 significant figures, or 1 decimal place for angles in degrees, unless a different level of accuracy is specified in the question.
请回答所有题目。适当时应使用计算器。必须清楚展示所有必要的计算过程;仅给出计算器答案而没有过程,不予评分。除非题目另有精度要求,非精确数值答案保留 3 位有效数字,以度为单位的角度保留 1 位小数。
解答
(a)
解法一
思路
展开
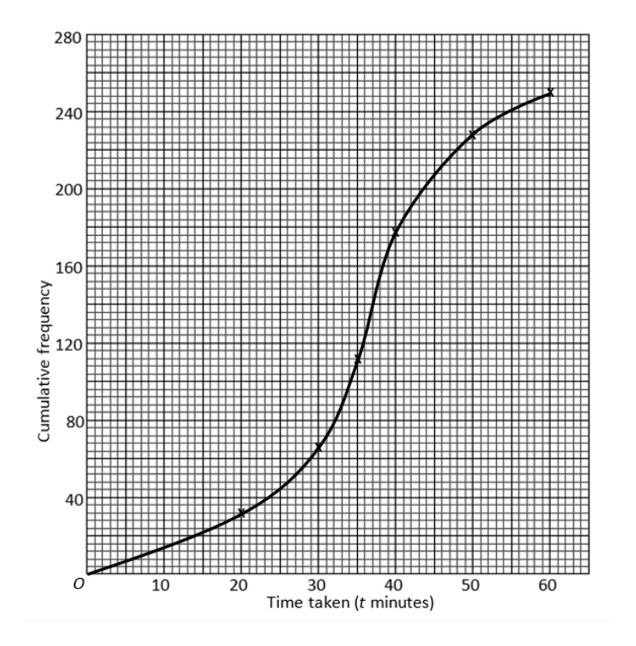
表格已经给累计频数,用各组上界描点,从原点画递增平滑曲线。
答题过程
展开
Plot
Use linear scales with time (minutes) on the horizontal axis and cumulative frequency on the vertical axis. Join the points with a smooth increasing curve.
(b)
解法一
思路
展开
第60百分位数对应累计频数150,从曲线读取时间。
答题过程
展开
The required cumulative frequency is . Read horizontally from 150 to the curve and then down to the time axis. The estimate is 38 minutes.
(c)
解法一
思路
展开
累计频数作差得到组频数,用中点求二阶矩,减去给定均值平方。
答题过程
展开
The frequencies and class midpoints are
| Time interval (minutes) | Frequency | Midpoint |
|---|---|---|
Thus
Using the given mean, the estimated standard deviation is