
题目
The weights, , of 120 students in a sports college are recorded. The results are summarised in the following table.
| Weight () | ||||||
|---|---|---|---|---|---|---|
| Cumulative frequency | 0 | 14 | 38 | 60 | 106 | 120 |
(a) Draw a cumulative frequency graph to represent this information.

(b) It is found that 35% of the students weigh more than .
Use your graph to estimate the value of .
(c) Calculate estimates for the mean and standard deviation of the weights of the 120 students.
题目中文翻译
记录某体育学院 120 名学生的体重 ,结果汇总于下表。
| 体重() | ||||||
|---|---|---|---|---|---|---|
| 累积频数 | 0 | 14 | 38 | 60 | 106 | 120 |
(a) 画一条累积频数曲线表示这些数据。
(b) 发现 35% 的学生体重大于 。
利用你所画的图估计 的值。
(c) 计算这 120 名学生体重的均值和标准差的估计值。
原卷通用作答要求
Answer all questions. You should use a calculator where appropriate.
You must show all necessary working clearly; no marks will be given for unsupported answers from a calculator.
Give non-exact numerical answers correct to 3 significant figures, or 1 decimal place for angles in degrees, unless a different level of accuracy is specified in the question.
请回答所有题目。适当时应使用计算器。必须清楚展示所有必要的计算过程;仅给出计算器答案而没有过程,不予评分。除非题目另有精度要求,非精确数值答案保留 3 位有效数字,以度为单位的角度保留 1 位小数。
解答
(a)
解法一
思路
展开
已经给累计频数,按各重量上界描点,从(40,0)画平滑递增曲线。
答题过程
展开
Plot the points
Use linear scales with weight (kg) on the horizontal axis and cumulative frequency on the vertical axis. Join the points with a smooth increasing curve starting at .
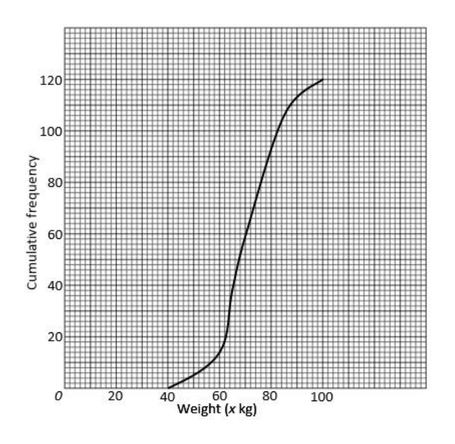
(b)
解法一
思路
展开
35%高于W,故W对应65%的累计人数,即78。
答题过程
展开
The required cumulative frequency is
Read horizontally from cumulative frequency 78 to the curve and then vertically down to the weight axis. This gives .
(c)
解法一
思路
展开
累计频数作差求实际组频数;40以下人数为0,无须给该空组虚构中点。
答题过程
展开
Subtract successive cumulative frequencies to obtain the class frequencies.
| Weight interval (kg) | Frequency | Midpoint |
|---|---|---|
There are no students weighing 40 kg or less. Hence
and
The estimated mean is
The estimated standard deviation is