
题目
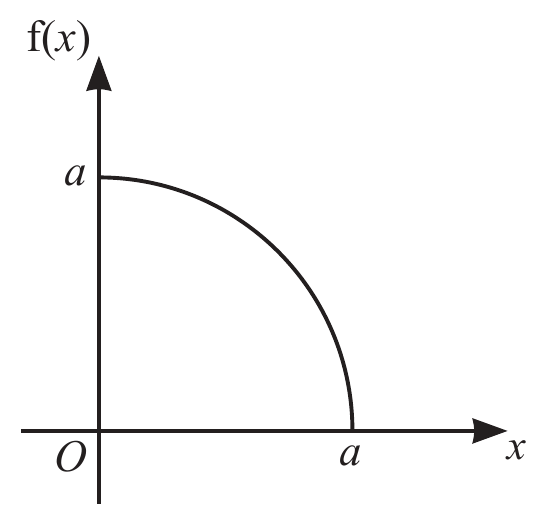
The diagram shows the graph of the probability density function, , of a random variable . The graph is a quarter circle entirely in the first quadrant with centre and radius , where is a positive constant. Elsewhere .
(a) Show that .
(b) Show that .
(c) Show that .
题目中文翻译
图中给出了随机变量 的概率密度函数 的图像。该图像是一段完全位于第一象限的四分之一圆弧,圆心为 ,半径为 ,其中 为正常数。在其余各处,。
(a) 证明 。
(b) 证明 。
(c) 证明 。
原卷通用作答要求
Answer all questions. You should use a calculator where appropriate.
You must show all necessary working clearly; no marks will be given for unsupported answers from a calculator.
Give non-exact numerical answers correct to 3 significant figures, or 1 decimal place for angles in degrees, unless a different level of accuracy is specified in the question.
请回答所有题目。适当时应使用计算器。必须清楚展示所有必要的计算过程;仅给出计算器答案而没有过程,不予评分。除非题目另有精度要求,非精确数值答案保留 3 位有效数字,以度为单位的角度保留 1 位小数。
解答
(a)
解法一
思路
展开
密度图下总面积为1,直接用四分之一圆的面积求正半径。
答题过程
展开
The total area under the density curve is 1, so
Since , , as required.
(b)
解法一
思路
展开
圆的方程为x平方加y平方等于半径平方;图形在第一象限,只取y的正平方根。
答题过程
展开
On the quarter circle,
so . Since the graph is in the first quadrant,
This holds for . Elsewhere .
(c)
解法一
思路
展开
用期望积分,识别根号内函数的导数与外面的x成比例,直接反向链式法则积分。
答题过程
展开
as required.