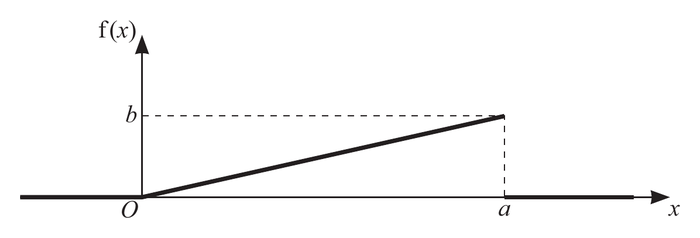
The diagram shows the graph of the probability density function, f(x), of a random variable X. For 0≤x≤a, the graph is a straight line from O to the point (a,b), where a and b are constants. Elsewhere f(x)=0.
(a) Show that the median of X is 2a.
(5)
(b) Given that E(X)=4, find a.
(4)
题目中文翻译
图中给出随机变量 X 的概率密度函数 f(x) 的图像。当 0≤x≤a 时,图像是从 O 到点 (a,b) 的直线段,其中 a 和 b 是常数。其余各处 f(x)=0。
(a) 证明 X 的中位数为 2a。
(5)
(b) 已知 E(X)=4,求 a。
(4)
原卷通用作答要求
Answer all questions. You should use a calculator where appropriate.
You must show all necessary working clearly; no marks will be given for unsupported answers from a calculator.
Give non-exact numerical answers correct to 3 significant figures, or 1 decimal place for angles in degrees, unless a different level of accuracy is specified in the question.