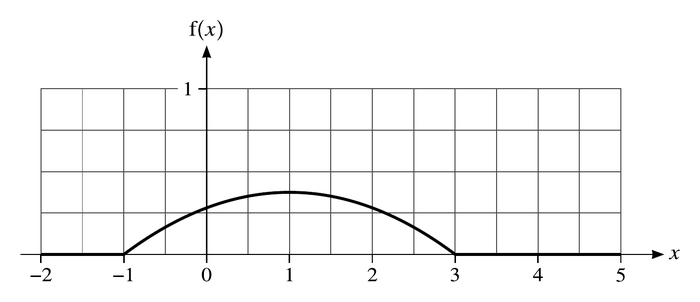
The diagram shows the graph of the probability density function of a random variable X that takes values between −1 and 3 only. It is given that the graph is symmetrical about the line x=1. Between x=−1 and x=3 the graph is a quadratic curve.
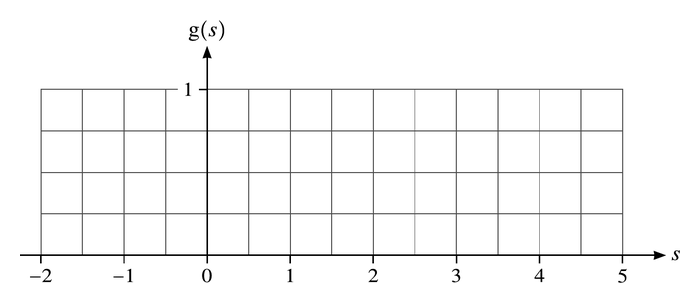
The random variable S is such that E(S)=2×E(X) and Var(S)=Var(X).
(a) On the grid below, sketch a quadratic graph for the probability density function of S.
(1)
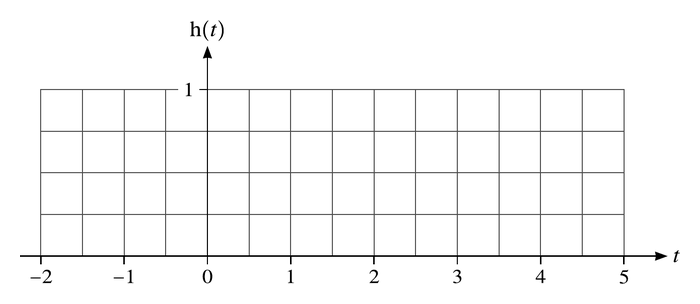
The random variable T is such that E(T)=E(X) and Var(T)=41Var(X).
(b) On the grid below, sketch a quadratic graph for the probability density function of T.
(2)
It is now given that
f(x)=⎩⎨⎧323(3+2x−x2)0−1≤x≤3,otherwise.
(c) Given that P(1−a<X<1+a)=0.5, show that a3−12a+8=0.
Answer all questions. You should use a calculator where appropriate.
You must show all necessary working clearly; no marks will be given for unsupported answers from a calculator.
Give non-exact numerical answers correct to 3 significant figures, or 1 decimal place for angles in degrees, unless a different level of accuracy is specified in the question.
The required density is the original quadratic curve shifted one unit to the right. It has zeros at s=0 and s=4, is symmetric about s=2, and has the same maximum height as the original curve.
(b)
解法一
思路
展开
将变量以均值1为中心压缩为原来一半,标准差减半、方差缩为四分之一;密度高度必须加倍才能保持面积1。
答题过程
展开
Take T=1+21(X−1). Then
E(T)=1,Var(T)=41Var(X).
The required quadratic density has zeros at t=0 and t=2 and is symmetric about t=1. Its maximum height is twice that of the original density, giving a vertex at (1,43).
(c)
解法一
思路
展开
令u等于x减1,把对称中心平移至0,密度化为3/32乘4减u平方,积分后整理。
答题过程
展开
Put u=x−1. Then 3+2x−x2=4−u2. Since the required probability is 0.5, 0<a<2, and
The function is continuous, so it has a root between these values. Also F′(a)=3a2−12<0 for 0<a<2, so this is the unique relevant root. Hence 0.69<a<0.70.