
题目
8.
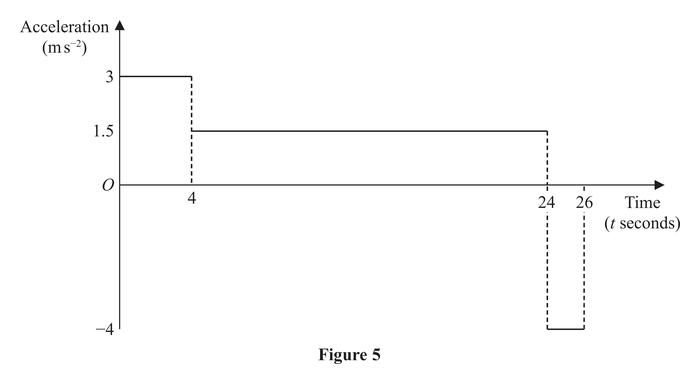
The acceleration-time graph shown in Figure 5 represents part of a journey made by a car along a straight horizontal road. The car accelerated from rest at time .
(a) Find the distance travelled by the car during the first of its journey.
(b) Find the total distance travelled by the car during the first of its journey.
题目中文翻译
图 5 中的加速度—时间图像表示一辆汽车沿水平直路行驶的部分过程。汽车在 时从静止开始加速。
(a) 求汽车在行程最初 内行驶的路程。
(b) 求汽车在行程最初 内行驶的总路程。
解答
(a)
解法一
思路
展开
加速度图像下的面积给速度变化,速度图像下的面积才给路程。先求 的速度,再用对应速度图像的三角形面积。
答题过程
展开
During , the acceleration is . Starting from rest, the speed at is
The velocity-time graph over this interval is a straight line from to . Its triangular area gives the distance:
(b)
解法一
思路
展开
每段加速度恒定,对应速度图像都是直线段,因此用梯形面积。最后一段虽然减速,速度仍然为正,路程可直接相加。
答题过程
展开
From (a), the speed at is . Between and , the acceleration is , so
This part of the velocity-time graph is a straight line, whose trapezium area is
During the last seconds, the acceleration is , so
The corresponding trapezium area gives
The velocity stays positive throughout, so the total distance is