
题目
Chi wanted to summarise the scores of the 39 competitors in a village quiz. He started to produce the following stem and leaf diagram
Key: is a score of 25
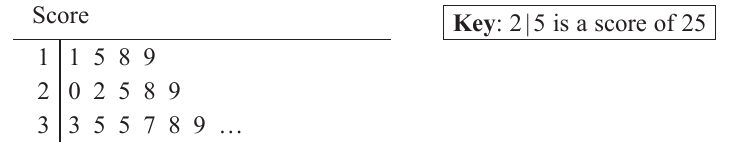
He did not complete the stem and leaf diagram but instead produced the following box plot.
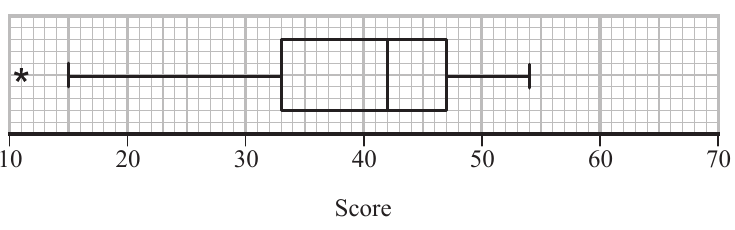
Chi defined an outlier as a value that is greater than or less than
(a) Find (i) the interquartile range (ii) the range.
(b) Describe, giving a reason, the skewness of the distribution of scores.
Albert and Beth asked for their scores to be checked.
Albert’s score was changed from 25 to 37
Beth’s score was changed from 54 to 60
(c) On the grid on page 5, draw an updated box plot. Show clearly any calculations that you used.
Some of the competitors complained that the questions were biased towards the younger generation. The product moment correlation coefficient between the age of the competitors and their score in the quiz is
(d) State, giving a reason, whether or not the complaint is supported by this statistic.
解答
(a)
解法一
思路
展开
从箱线图读出 、,最小值 11,最大值 54。
答题过程
展开
The range is
(b)
解法一
思路
展开
比较中位数到上下四分位数的距离。左边距离 ,右边距离 ,左侧更长,所以负偏态。
答题过程
展开
whereas
Since , the distribution is negatively skewed.
(c)
解法一
思路
展开
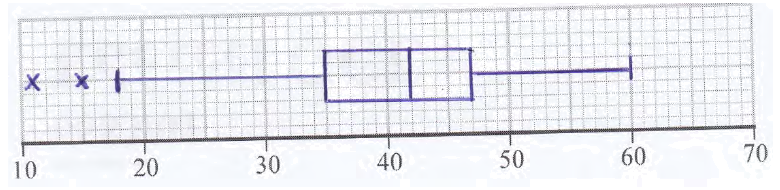
改分后,下四分位数变成 35,上四分位数仍为 47,中位数仍为 42。重新计算 IQR 和离群值边界。
答题过程
展开
The new lower quartile is
The median remains , and the upper quartile remains .
So the new IQR is
The lower outlier boundary is
The upper outlier boundary is
So the outliers are and .
The updated box plot should have a box from to , median , whiskers to and , and outliers at and .
(d)
解法一
思路
展开
很接近 0,说明相关性很弱,不能支持“年龄越小分数越高”这种说法。
答题过程
展开
The complaint is not supported.
The product moment correlation coefficient is close to 0, so there is only very weak correlation between age and score.