题目
Ranpose hospital offers services to a large number of clinics that refer patients to a range of hospitals. The manager at Ranpose hospital took a random sample of 16 clinics and recorded
the distance, km, of the clinic from Ranpose hospital
the percentage, , of the referrals from the clinic who attend Ranpose hospital.
The data are summarised as
(a) Find the product moment correlation coefficient for these data.
(b) Give an interpretation of your correlation coefficient.
The manager at Ranpose hospital believes that there may be a linear relationship between the distance of a clinic from the hospital and the percentage of the referrals who attend the hospital. She drew the following scatter diagram for these data.
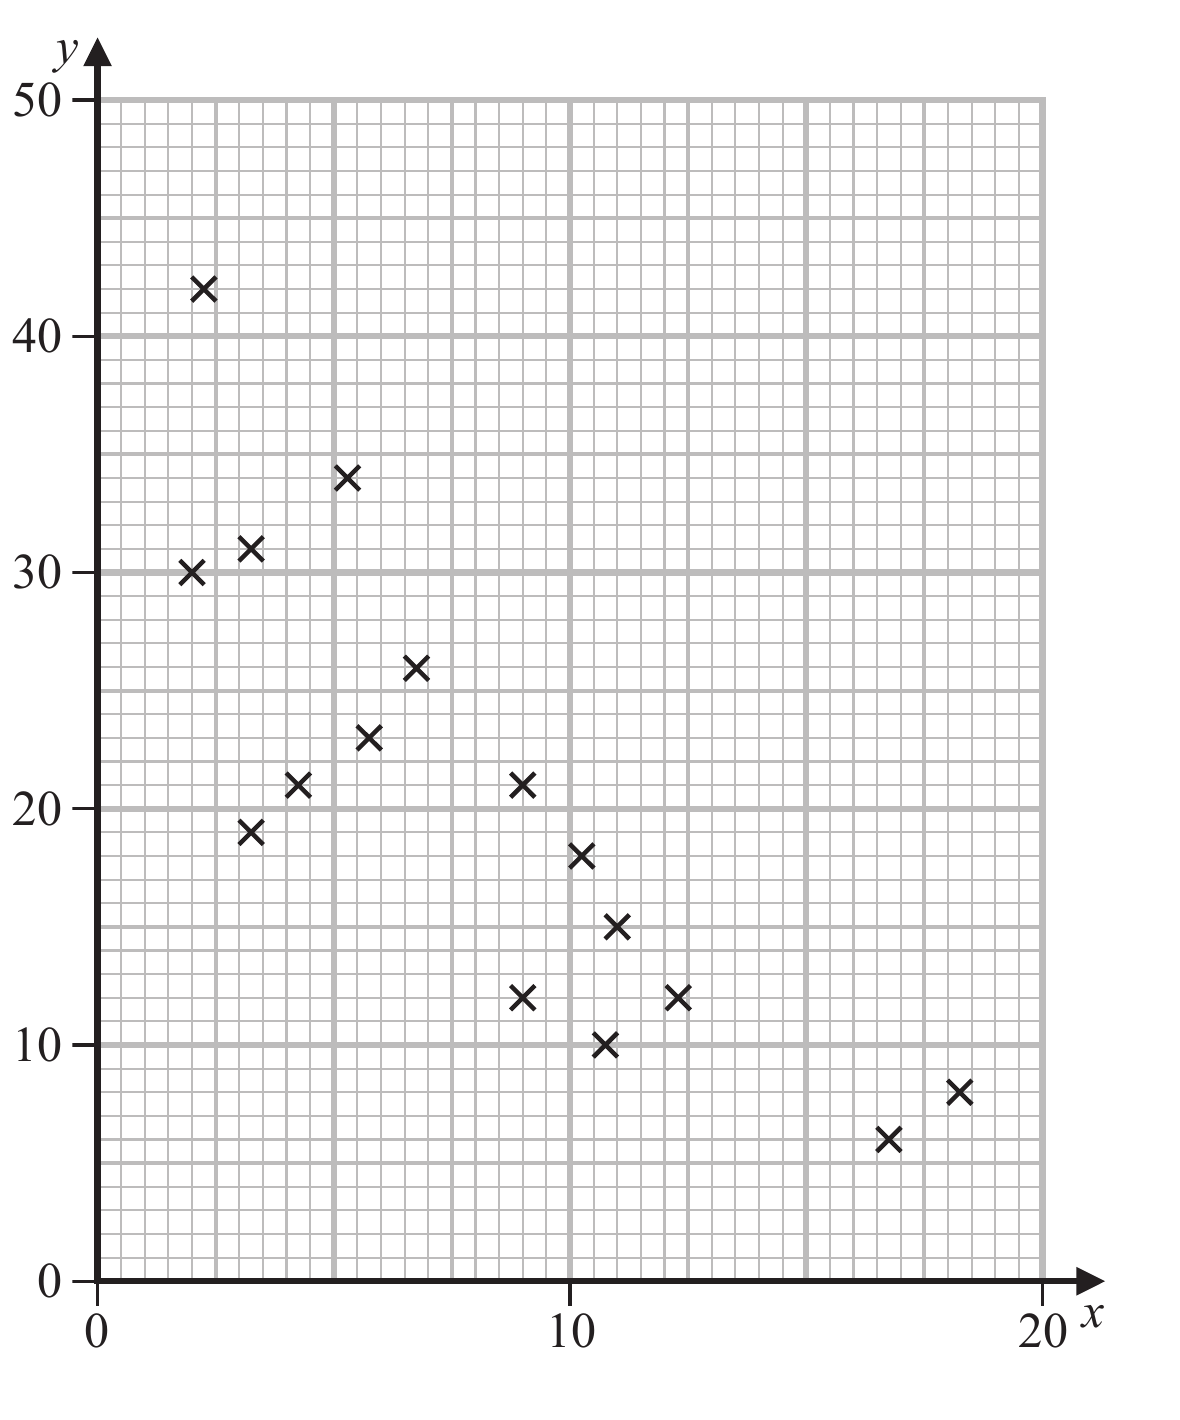
(c) State, giving a reason, whether or not these data support the manager’s belief.
The summary data and the scatter diagram are repeated below.
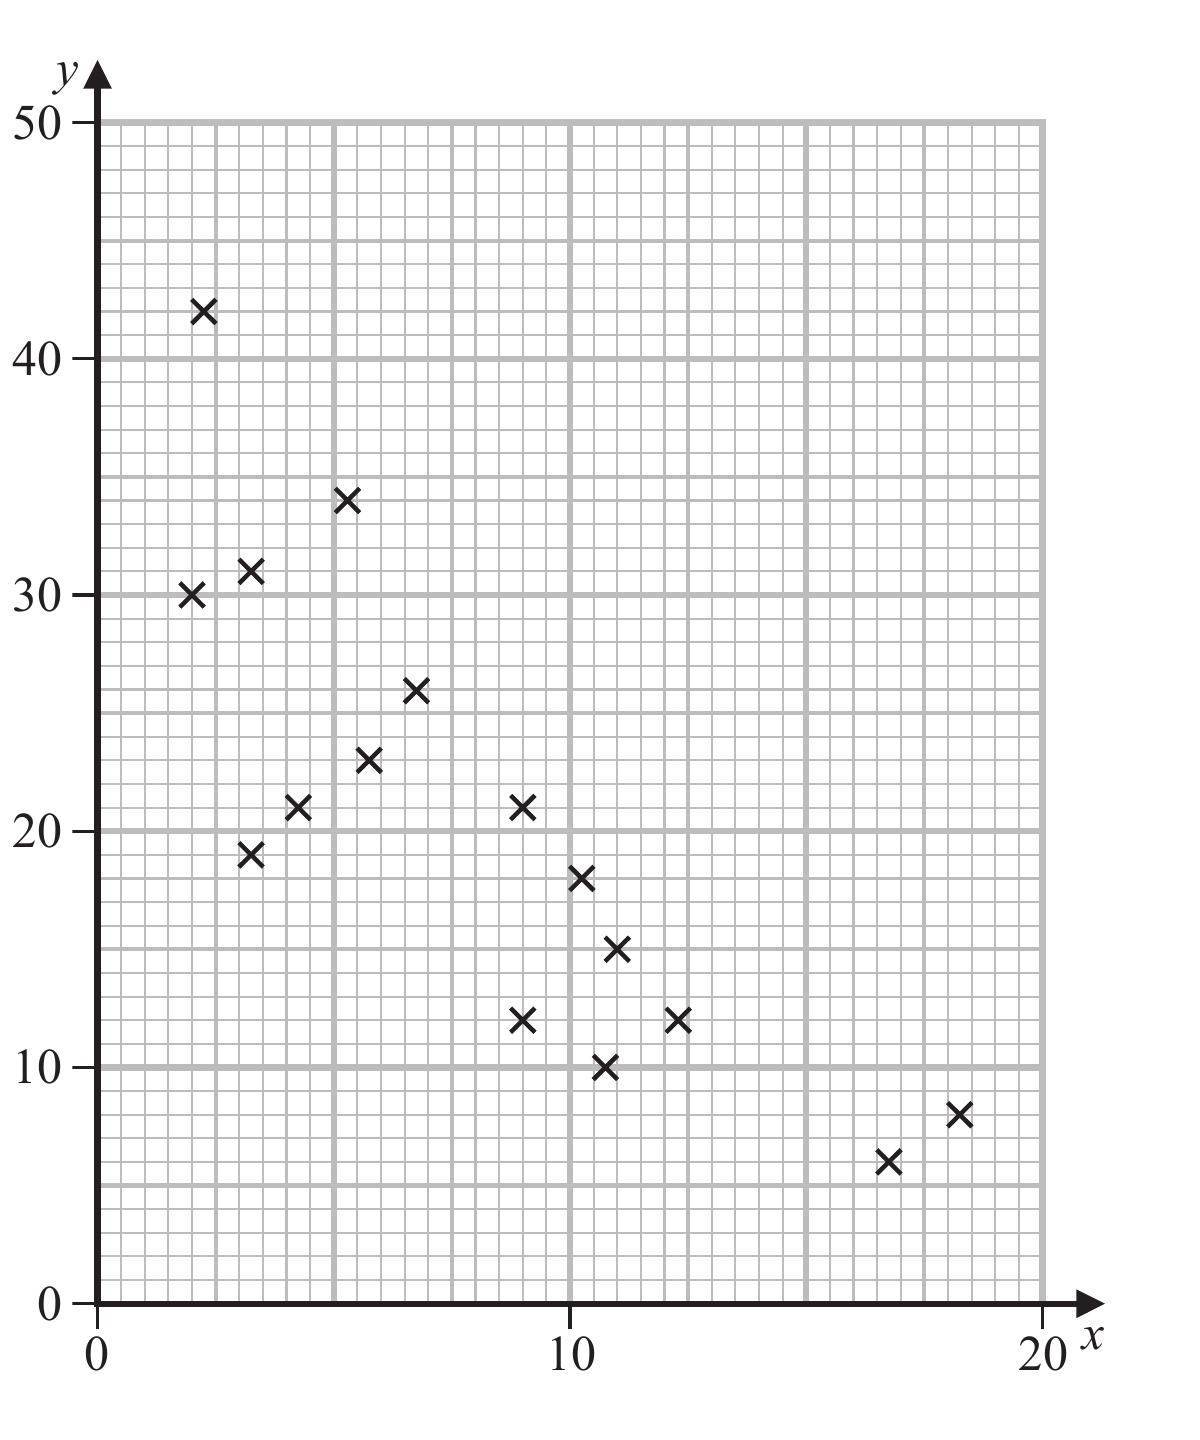
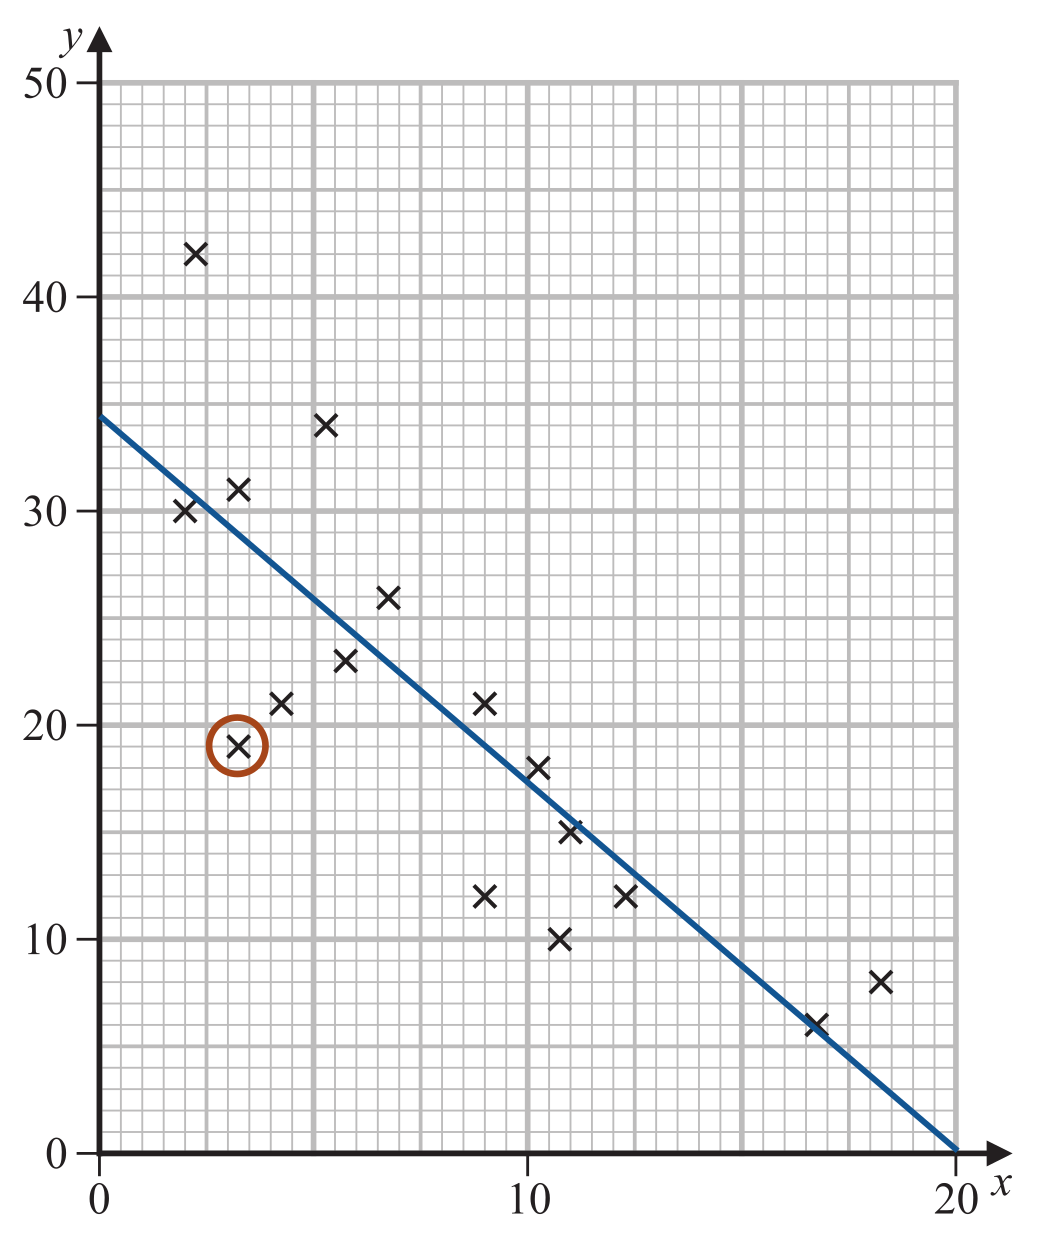
(d) Find the equation of the regression line of on , giving your answer in the form
(e) Give an interpretation of the gradient of your regression line.
(f) Draw your regression line on the scatter diagram.
The manager believes that Ranpose hospital should be attracting an “above average” percentage of referrals from clinics that are less than 5 km from the hospital. She proposes to target one clinic with some extra publicity about the services Ranpose offers.
(g) On the scatter diagram circle the point representing the clinic she should target.
题目中文翻译
Ranpose 医院为许多诊所提供服务,这些诊所会把病人转诊到不同医院。经理随机抽取 16 家诊所,记录诊所距 Ranpose 医院的距离 km,以及该诊所转诊病人中前往 Ranpose 医院的百分比 ,资料汇总如题。
(a) 求这些资料的积矩相关系数。
(b) 解释该相关系数。
经理认为诊所距医院的距离与前往该院的转诊百分比之间可能存在线性关系,并绘制散点图。
(c) 说明资料是否支持经理的看法,并给出理由。
(d) 求 关于 的回归直线,答案写成 。
(e) 解释回归直线的斜率。
(f) 在散点图上画出回归直线。
经理认为,距离医院不足 5 km 的诊所应有“高于平均”的转诊百分比,并打算选择一家诊所额外宣传服务。
(g) 在散点图上圈出她应选择的诊所所对应的点。
解答
(a)
解法一
思路
展开
先求 ,再代入 。
答题过程
展开
Since and ,
So
Therefore
Hence
(b)
解法一
思路
展开
负相关表示距离越远,来 Ranpose hospital 的 referral 百分比通常越低。
答题过程
展开
As the distance from Ranpose hospital increases, the percentage of referrals attending Ranpose hospital tends to decrease.
(c)
解法一
思路
展开
散点图大致沿一条下降直线排列,且 接近 ,支持线性关系。
答题过程
展开
Yes. The points lie close to a straight line with negative gradient, so the data support the manager’s belief.
(d)
解法一
思路
展开
回归线 on 的斜率是 ,截距用 求。
答题过程
展开
Also,
So
Therefore the regression line is
(e)
解法一
思路
展开
斜率约为 ,表示距离每增加 1 km,referrals percentage 平均下降约 1.7 percentage points。
答题过程
展开
For each extra kilometre from the hospital, the percentage of referrals attending Ranpose hospital decreases by about percentage points.
(f)
解法一
思路
展开
画线可取两个点,例如 和 。
答题过程
展开
Using ,
Draw the line through approximately and .
(g)
解法一
思路
展开
要找距离小于 5 km 且 referral percentage 低于平均表现、最值得宣传的点。图中对应点约为 。
答题过程
展开
Circle the point approximately