
题目
A random sample of 10 boys A, B, C, D, E, F, G, H, I and J is taken from a junior athletics club. Each boy selected is asked to run a 100 metre race and a 200 metre race. The time taken, seconds, by each boy to run the 100 metre race is recorded and the time taken, seconds, by each boy to run the 200 metre race is recorded. The results are plotted on the scatter diagram below.
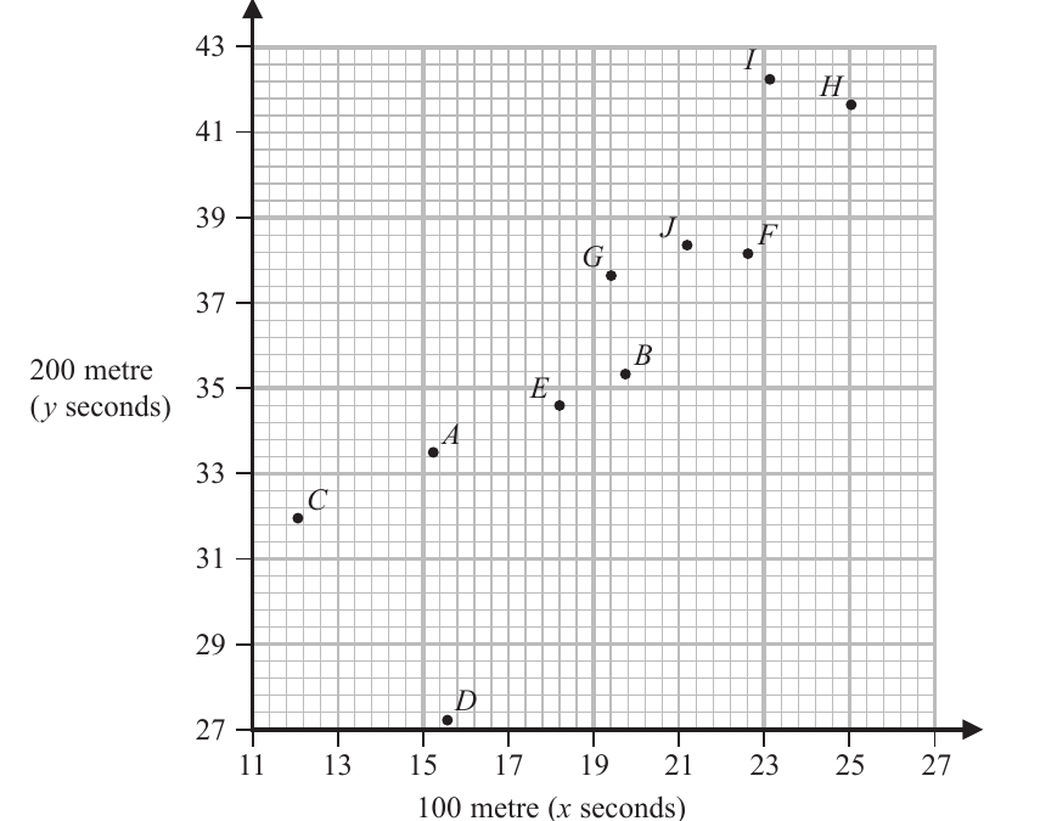
(a) State, without calculation, which of the 3 values below is most likely to be a value of the product moment correlation coefficient for the data in the scatter diagram.
In the sample of 10 boys, one is a junior champion 100 metre runner and one is a junior champion 200 metre runner.
(b) Write down the boy who is most likely to be the 100 metre junior champion.
The data for the two junior champions are removed and the remaining data are summarised below
(c) (i) Calculate the value of the product moment correlation coefficient for the remaining data.
(ii) Comment, in context, on the value of the product moment correlation coefficient that you obtained in part (i).
解答
(a)
解法一
思路
展开
图中整体是正相关,但有两个明显偏离主趋势的点,所以相关性不会接近 0.95,最合理是 0.72。
答题过程
展开
The most likely value is
(b)
解法一
思路
展开
100 metre champion 应该有最小的 100 metre time,也就是图中 值最小的点。
答题过程
展开
The boy most likely to be the 100 metre junior champion is
(c)
解法一
思路
展开
剩下 8 个数据。先用 和 求 ,再代入 的公式。
答题过程
展开
For the remaining 8 boys,
So
Therefore
Hence
This shows that boys who are faster in the 100 metres also tend to be faster in the 200 metres.