
题目
A group of students took some tests. A teacher is analysing the average mark for each student. Each student obtained a different average mark.
For these average marks, the lower quartile is 24, the median is 30 and the interquartile range (IQR) is 10
The three lowest average marks are 8, 10 and 15.5 and the three highest average marks are 45, 52.5 and 56
The teacher defines an outlier to be a value that is either more than below the lower quartile or more than above the upper quartile
(a) Determine any outliers in these data.
(b) On the grid below draw a box plot for these data, indicating clearly any outliers.
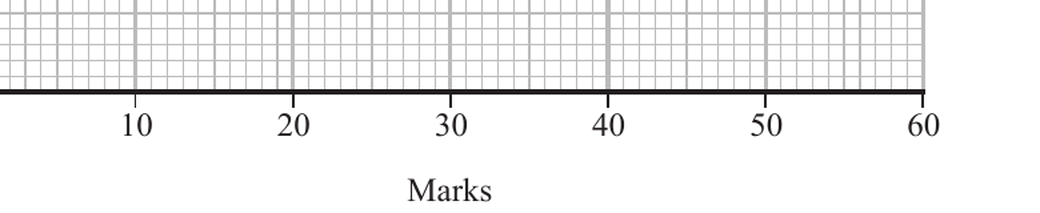
(c) Use the quartiles to describe the skewness of these data. Give a reason for your answer.
Two more students also took the tests. Their average marks, which were both less than 45, are added to the data and the box plot redrawn.
The median and the upper quartile are the same but the lower quartile is now 26
(d) Redraw the box plot on the grid below.

(e) Give ranges of values within which each of these students’ average marks must lie.
解答
(a)
解法一
思路
展开
已知 ,IQR 为 10,所以 。先算上下离群值边界,再判断给出的极端值。
答题过程
展开
Since
we have
The lower outlier boundary is
The upper outlier boundary is
So outliers are values less than or greater than .
Therefore the outliers are
(b)
解法一
思路
展开
盒子画 。非离群最小值是 10,非离群最大值是 45;8、52.5、56 要单独标成离群点。
答题过程
展开
Draw a box from to , with the median at .
Draw whiskers to and .
Show , and separately as outliers.
(c)
解法一
思路
展开
用中位数到上下四分位数的距离比较偏态。
答题过程
展开
Also,
Since
the data are negatively skewed.
(d)
解法一
思路
展开
新 ,中位数和 不变。重新计算 IQR 和离群值边界。
答题过程
展开
The new IQR is
The new lower boundary is
The new upper boundary is
So and are lower outliers, and and are upper outliers.
The value is not an outlier.
Draw a box from to , with the median at .
Draw whiskers to and .
Show , , and separately as outliers.
(e)
解法一
思路
展开
加入两个新数据后, 从 24 变成 26,而中位数仍是 30,所以其中一个新数据必须在 26 到 30 之间; 保持不变且两者都小于 45,所以另一个在 34 到 45 之间。
答题过程
展开
One of the new marks must lie in the range
The other new mark must lie in the range