
题目
Students on a psychology course were given a pre-test at the start of the course and a final exam at the end of the course. The teacher recorded the number of marks achieved on the pre-test, , and the number of marks achieved on the final exam, , for students and displayed them on the scatter diagram.
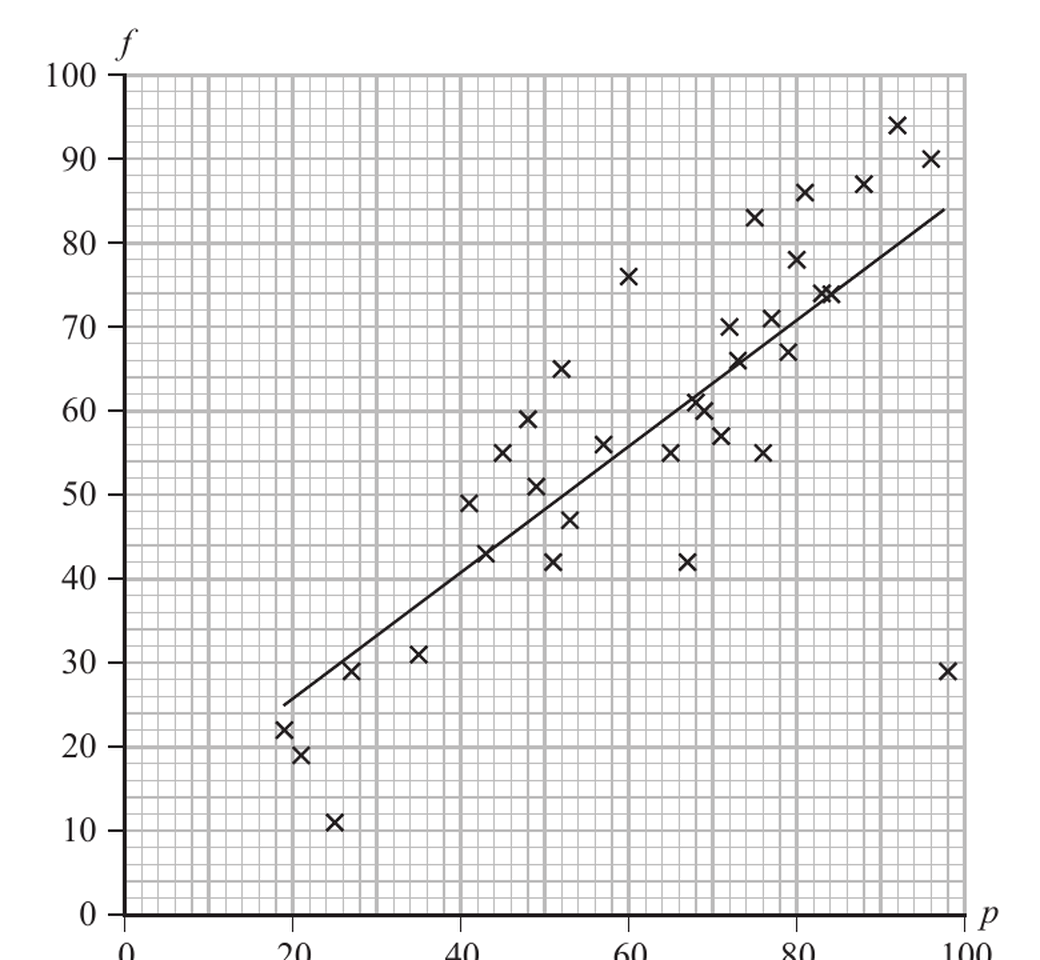
The equation of the least squares regression line for these data is found to be
For these students, the mean number of marks on the pre-test is
(a) Use the regression model to find the mean number of marks on the final exam.
(b) Give an interpretation of the gradient of the regression line.
Considering the equation of the regression line, Priya says that she would expect someone who scored marks on the pre-test to score marks on the final exam.
(c) Comment on the reliability of Priya’s statement.
(d) Write down the number of marks achieved on the final exam for the student who exceeded the expectation of the regression model by the largest number of marks.
(e) Find the range of values of for which this regression model, , predicts a greater number of marks on the final exam than on the pre-test.
Later the teacher discovers an error in the recorded data. The student who achieved a score of on the pre-test, scored not on the final exam. The summary statistics used for the model are corrected to include this information and a new least squares regression line is found.
Given the original summary statistics were,
(f) calculate the gradient of the new regression line. Show your working clearly.
解答
(a)
解法一
思路
展开
回归线经过 ,所以把 代入即可。
答题过程
展开
So the mean number of marks on the final exam is
to significant figures.
(b)
解法一
思路
展开
斜率要结合两个变量的语境解释。
答题过程
展开
For each additional mark scored on the pre-test, the final exam mark increases by about on average.
(c)
解法一
思路
展开
从散点图看,数据没有接近 的点,所以这是范围外估计。
答题过程
展开
Priya’s statement is not reliable because is outside the range of the data.
(d)
解法一
思路
展开
从散点图看,超过回归线最多的点对应 final exam mark 为 。
答题过程
展开
The number of marks is
(e)
解法一
思路
展开
要求模型预测 final exam marks 大于 pre-test marks,即 。
答题过程
展开
We need
So
Therefore
(f)
解法一
思路
展开
没有改,所以 不变。错误只影响 和 :把 改为 ,即 增加 ,而 增加 。
答题过程
展开
The corrected value of is
The original value of can be found from :
So the corrected value of is
Therefore
The new gradient is
So the gradient is approximately