
题目
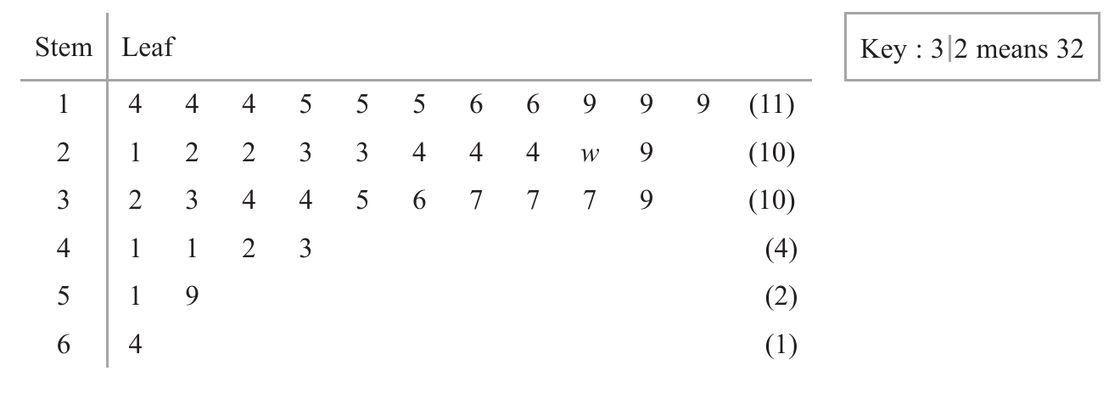
The company Seafield requires contractors to record the number of hours they work each week. A random sample of weeks is taken and the number of hours worked per week by contractor Kiana is summarised in the stem and leaf diagram below.
The quartiles for this distribution are summarised in the table below.
(a) Find the values of , and
Kiana is looking for outliers in the data. She decides to classify as outliers any observations greater than
(b) Showing your working clearly, identify any outliers that Kiana finds.
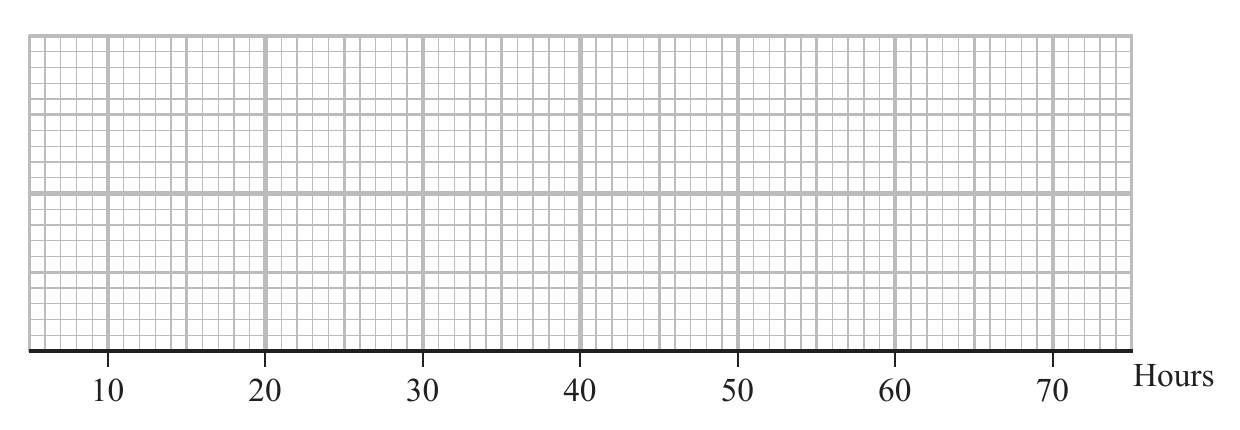
(c) Draw a box plot for these data in the space provided on the grid opposite.
(d) Use the formula
to find the skewness of these data. Give your answer to significant figures.
Kiana’s new employer, Landacre, wishes to know the average number of hours per week she worked during her employment at Seafield to help calculate the cost of employing her.
(e) Explain why Landacre might prefer to know Kiana’s mean, rather than median, number of hours worked per week.
题目中文翻译
Seafield 公司要求承包商记录每周工作的小时数。随机抽取 周,承包商 Kiana 每周工作的小时数汇总在题图的茎叶图中。
该分布的四分位数汇总在表格中。
(a) 求 、 和 的值。
Kiana 正在寻找数据中的异常值。她决定把所有大于
的观测值判定为异常值。
(b) 清楚写出过程,并找出 Kiana 得到的所有异常值。
(c) 在题图所给网格上画出这些数据的箱线图。
(d) 使用公式
求这些数据的偏度,答案保留 位有效数字。
Kiana 的新雇主 Landacre 想知道她在 Seafield 任职期间每周工作的平均小时数,以帮助计算雇用她的成本。
(e) 解释为什么 Landacre 可能更希望知道 Kiana 每周工作小时数的平均数,而不是中位数。
解答
(a)
解法一
思路
展开
stem-and-leaf 每行右侧给了该 stem 的总数。第二行一共有 个 leaf,所以缺的 要使这一行仍按大小顺序排列。共有 个数据, 是第 个, 是第 个。
答题过程
展开
The missing leaf is
The lower quartile is the th value, so
The upper quartile is the th value, so
(b)
解法一
思路
展开
按题目定义,只找大于上界的 outliers。先算 。
答题过程
展开
The observations greater than are
Therefore Kiana finds and as outliers.
(c)
解法一
思路
展开
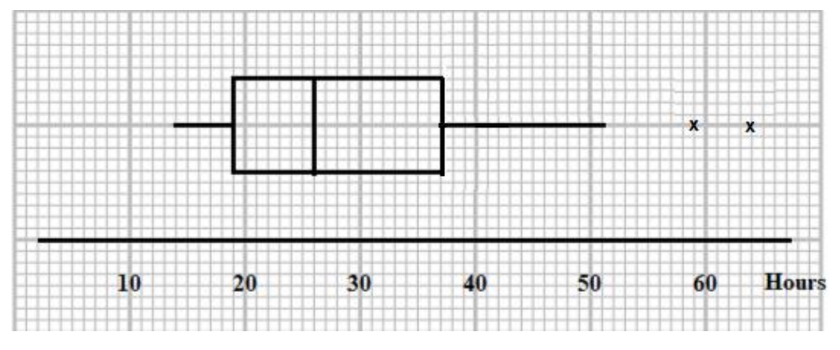
箱体用 、median 、。由于 和 是 outliers,上须单独标出;upper whisker 到最大非 outlier,也就是 。lower whisker 到最小值 。
答题过程
展开
Draw the box plot using
(d)
解法一
思路
展开
直接代入公式。注意这里公式等价于 。
答题过程
展开
So the skewness is
to significant figures.
(e)
解法一
思路
展开
Landacre 是为了估算雇佣成本,因此总工作时长更相关。mean 会使用所有数据,包括较大的工作时长;median 只反映中间位置。
答题过程
展开
Landacre may prefer the mean because it uses all the data, including the unusually large numbers of hours, so it is more useful for estimating employment cost.