Skip to content
CalcGospel 國際數學圖譜
返回

S1 2023 Jan Q6

A Level / Edexcel / S1

IAL 2023 Jan Paper · Question 6

题目

Problem

A research student is investigating the maximum weight, yy grams, of sugar that will dissolve in 100100 grams of water at various temperatures, x∘x^\circC, where 10⩽x⩽8010\leqslant x\leqslant80

The research student calculated the regression line of yy on xx and found it to be

y=151.2+2.72xy=151.2+2.72x

(a) Give an interpretation of the gradient of the regression line.

(1)

(b) Use the regression line to estimate the maximum weight of sugar that will dissolve in 100100 grams of water when the temperature is 90∘90^\circC.

(2)

(c) Comment on the reliability of your estimate, giving a reason for your answer.

(2)

Using the regression line of yy on xx and the following summary statistics

∑y=3119∑y2=851093∑x2=24500n=12\sum y=3119\qquad \sum y^2=851093\qquad \sum x^2=24500\qquad n=12

(d) show that the product moment correlation coefficient for these data is 0.9880.988 to 33 decimal places.

(7)

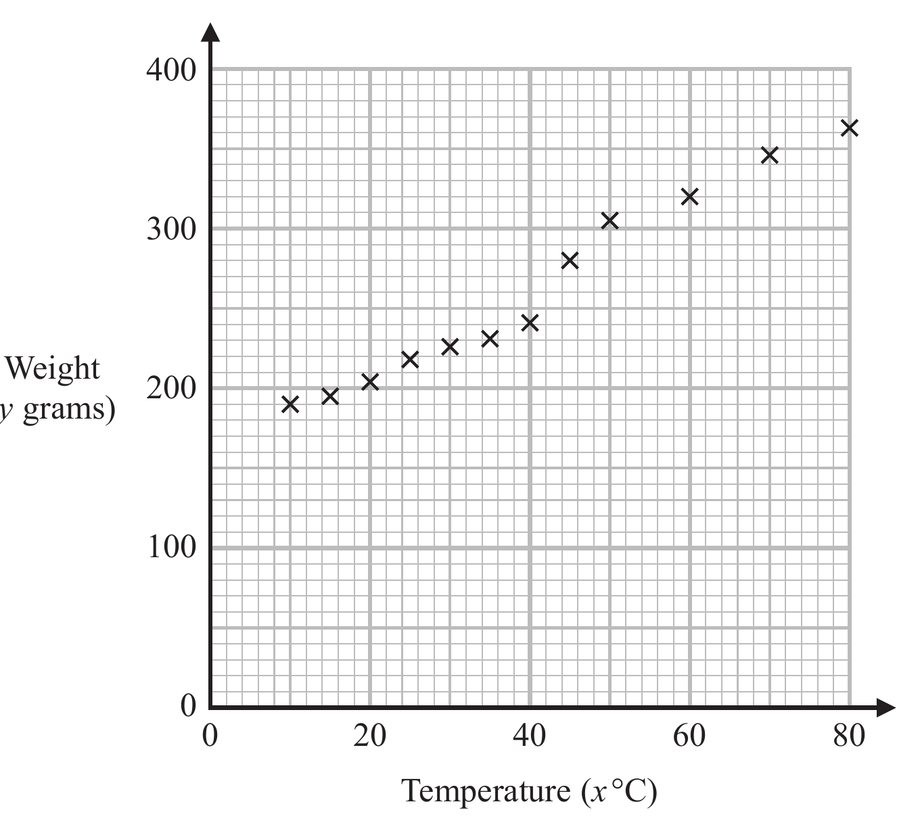
The research student’s supervisor plotted the original data on a scatter diagram, shown on page 2323

With reference to both the scatter diagram and the correlation coefficient,

(e) discuss the suitability of a linear regression model to describe the relationship between xx and yy.

(2)
题目中文翻译

一名研究生正在研究不同温度 x∘x^\circC 下,100100 克水中最多能够溶解的糖的质量 yy 克,其中 10⩽x⩽8010\leqslant x\leqslant80。

该研究生算得 yy 对 xx 的回归直线为 y=151.2+2.72xy=151.2+2.72x。

(a) 解释这条回归直线斜率的意义。

(b) 使用回归直线估计温度为 90∘90^\circC 时,100100 克水中最多能够溶解的糖的质量。

(c) 评论这一估计的可靠性,并说明理由。

利用 yy 对 xx 的回归直线以及题目所给的汇总统计量:

(d) 证明这些数据的积矩相关系数为 0.9880.988(精确到 33 位小数)。

研究生的导师把原始数据绘制成题目所示的散点图。

(e) 同时参考散点图和相关系数,讨论使用线性回归模型描述 xx 与 yy 之间关系的适用性。

解答

(a)

解法一

思路

展开

斜率 2.722.72 要解释成温度每增加 1∘1^\circC,糖的最大溶解质量平均增加多少。

答题过程

展开

For each increase of 1∘1^\circC in temperature, the maximum weight of sugar that dissolves increases by about 2.722.72 grams.

(b)

解法一

思路

展开

直接把 x=90x=90 代入回归线。

答题过程

展开 y= 151.2+2.72(90)= 396.\begin{align*} y =&\,151.2+2.72(90)\\ =&\,396. \end{align*}

The estimate is

396 grams.\begin{align*} 396\text{ grams}. \end{align*}

(c)

解法一

思路

展开

原始数据的温度范围是 10⩽x⩽8010\leqslant x\leqslant80,而 90∘90^\circC 在范围外,所以这是 extrapolation。

答题过程

展开

The estimate is unreliable because 90∘90^\circC is outside the range of the data, 10⩽x⩽8010\leqslant x\leqslant80.

(d)

解法一

思路

展开

先用回归线和 ∑y\sum y 求 ∑x\sum x。再求 SyyS_{yy}、SxxS_{xx}。因为 yy on xx 的斜率是 2.722.72,所以 Sxy=2.72SxxS_{xy}=2.72S_{xx}。

答题过程

展开

From

y=151.2+2.72x,\begin{align*} y=151.2+2.72x, \end{align*}

we have

yˉ=151.2+2.72xˉ.\begin{align*} \bar{y}=151.2+2.72\bar{x}. \end{align*}

Now

yˉ=311912.\begin{align*} \bar{y}=\frac{3119}{12}. \end{align*}

So

xˉ= 311912−151.22.72= 39.969…\begin{align*} \bar{x} =&\,\frac{\frac{3119}{12}-151.2}{2.72}\\ =&\,39.969\ldots \end{align*}

Thus

∑x=12(39.969…)=479.632…\begin{align*} \sum x=12(39.969\ldots)=479.632\ldots \end{align*}

Also,

Syy= 851093−3119212= 40412.916…\begin{align*} S_{yy} =&\,851093-\frac{3119^2}{12}\\ =&\,40412.916\ldots \end{align*}

and

Sxx= 24500−(479.632…)212= 5329.400…\begin{align*} S_{xx} =&\,24500-\frac{(479.632\ldots)^2}{12}\\ =&\,5329.400\ldots \end{align*}

Since the gradient of the regression line of yy on xx is

SxySxx=2.72,\begin{align*} \frac{S_{xy}}{S_{xx}}=2.72, \end{align*}

we get

Sxy=2.72(5329.400…)=14495.969…\begin{align*} S_{xy}=2.72(5329.400\ldots)=14495.969\ldots \end{align*}

Therefore

r= SxySxxSyy= 14495.969…5329.400…(40412.916…)= 0.988…\begin{align*} r =&\,\frac{S_{xy}}{\sqrt{S_{xx}S_{yy}}}\\ =&\,\frac{14495.969\ldots} {\sqrt{5329.400\ldots(40412.916\ldots)}}\\ =&\,0.988\ldots \end{align*}

So the product moment correlation coefficient is 0.9880.988 to 33 decimal places.

解法二

思路

展开

由回归斜率 b=2.72=rSyy/Sxxb=2.72=r\sqrt{S_{yy}/S_{xx}},可直接求 rr。

答题过程

展开

Using the values of SxxS_{xx} and SyyS_{yy} found above,

r= 2.72SxxSyy= 2.725329.400…40412.916…= 0.988…\begin{align*} r =&\,2.72\sqrt{\frac{S_{xx}}{S_{yy}}}\\ =&\,2.72\sqrt{\frac{5329.400\ldots}{40412.916\ldots}}\\ =&\,0.988\ldots \end{align*}

Therefore r=0.988r=0.988 to 33 decimal places.

(e)

解法一

思路

展开

需要同时提到 scatter diagram 和 correlation coefficient。图上点接近一条直线,而且 rr 接近 11,说明线性模型合适。

答题过程

展开

The scatter diagram shows that the points lie reasonably close to a straight line. Also, the product moment correlation coefficient is close to 11.

Therefore a linear regression model is suitable for describing the relationship between xx and yy.