
题目
A researcher is investigating the growth of two types of tree, Birch and Maple. The height, to the nearest cm, a seedling grows in one year is recorded for Birch trees and Maple trees. The results are summarised in the back-to-back stem and leaf diagram below.
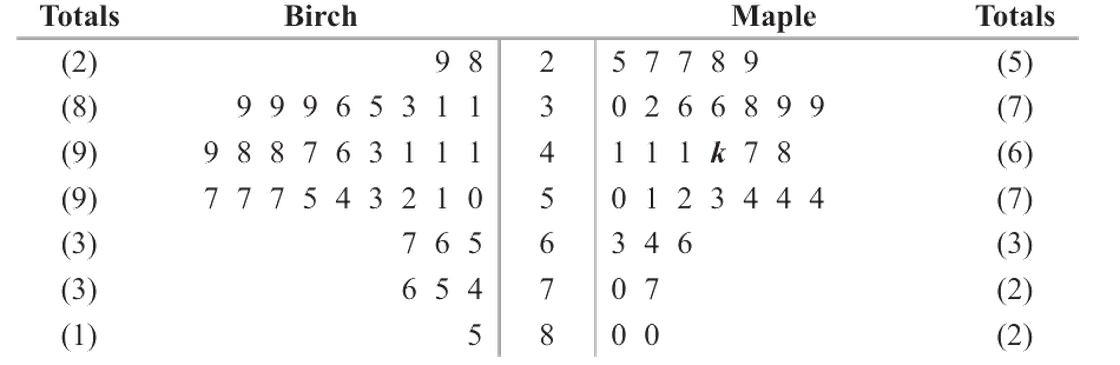
Key: means cm for a Birch tree and cm for a Maple tree.
The median height that these Maple trees grow in one year is cm.
(a) Find the value of , used in the stem and leaf diagram.
(b) Find the lower quartile and the upper quartile of the height grown in one year for these Birch trees.
The researcher defines an outlier as an observation that is
or
(c) Show that there is only one outlier amongst the Birch trees.
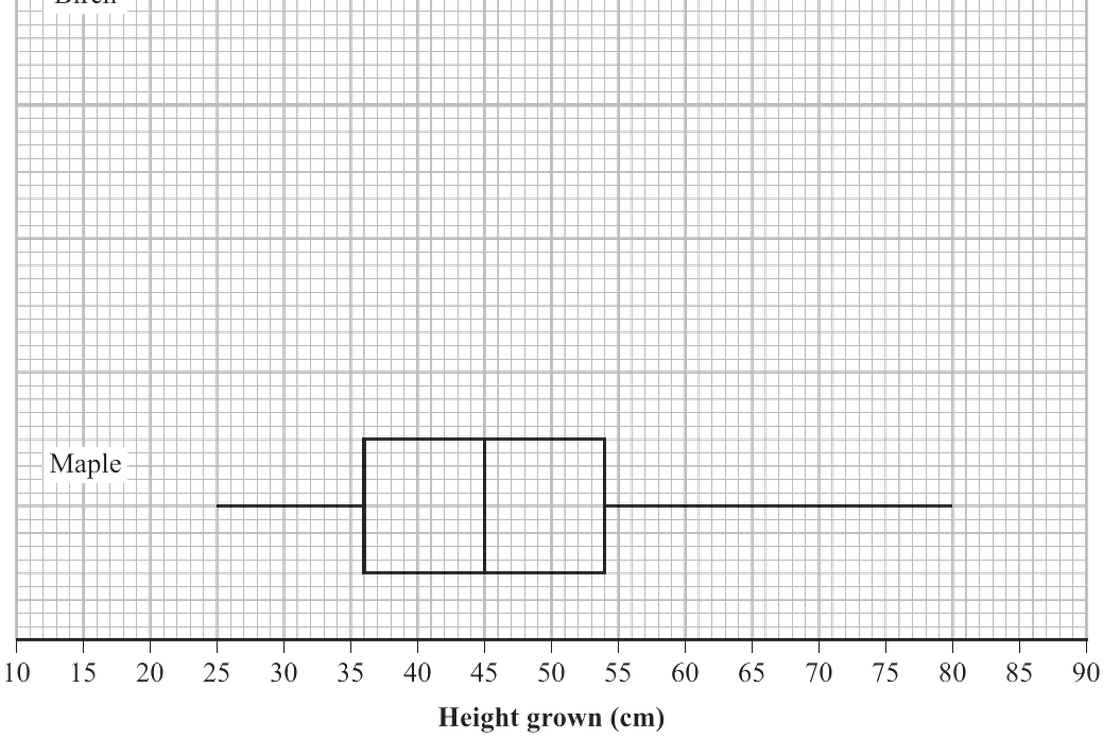
The grid on page 3 shows a box plot for the heights that the Maple trees grow in one year.
(d) On the same grid draw a box plot for the heights that the Birch trees grow in one year.
(e) Comment on any difference in the distributions of the growth of these Birch trees and the growth of these Maple trees. State the values of any statistics you have used to support your comment.
The researcher realises he has missed out pieces of data for the Maple trees. The heights each seedling grows in one year, to the nearest cm, in ascending order, for these Maple trees are cm, cm, cm, cm.
Given that there is no change to the box plot for the Maple trees given on page 3
(f) find the range of possible values for . Show your working clearly.
解答
(a)
解法一
思路
展开
Maple 有 个数据,所以中位数是第 个和第 个的平均数。题目说中位数是 ,因此第 和第 个都应围绕 。
答题过程
展开
For the Maple trees, the median is cm. Reading the ordered Maple data from the stem and leaf diagram, this gives
(b)
解法一
思路
展开
Birch 有 个数据。中位数是第 个;下四分位数是前 个的中位数,也就是第 个;上四分位数是后 个的中位数,也就是第 个。
答题过程
展开
For Birch trees,
and
Reading from the stem and leaf diagram,
(c)
解法一
思路
展开
先求 IQR,再求上下 outlier boundary。Birch 的最小值是 ,最大值是 。只要 超过上界,而 没有低于下界,就只有一个 outlier。
答题过程
展开
The interquartile range is
The lower outlier boundary is
The upper outlier boundary is
The minimum Birch value is , which is not less than . The maximum Birch value is , which is greater than .
Therefore there is only one outlier, namely
(d)
解法一
思路
展开
画 Birch box plot 需要五数概括,并且要把 outlier 单独标出。由于 是 outlier,右端 whisker 不能画到 ,而应画到最大非 outlier 值 。
答题过程
展开
For the Birch trees,
The largest value that is not an outlier is
The value
is plotted separately as an outlier.
So the Birch box plot should have whiskers at and , a box from to , a median line at , and a separate outlier at .
(e)
解法一
思路
展开
只需说一个合理差异,并给统计量。最直接是比较中位数:Birch 的中位数是 ,Maple 的中位数是 。
答题过程
展开
On average, Birch trees grow slightly taller than Maple trees in one year, since the median for Birch trees is
whereas the median for Maple trees is
(f)
解法一
思路
展开
加入 个 Maple 数据后,box plot 不变,表示下四分位数、上四分位数、端点等不会被这些新数据改变。根据排序给出的新数据是
要保持 的升序,且不改变 Maple box plot,最终范围会由 和 的位置限制出来。
答题过程
展开
Since the four values are in ascending order,
and
So
For the Maple box plot to remain unchanged, the new value must not move the lower part of the box plot, giving
Also the new value must not exceed the upper whisker value , so
Hence
Therefore the possible range is