
题目
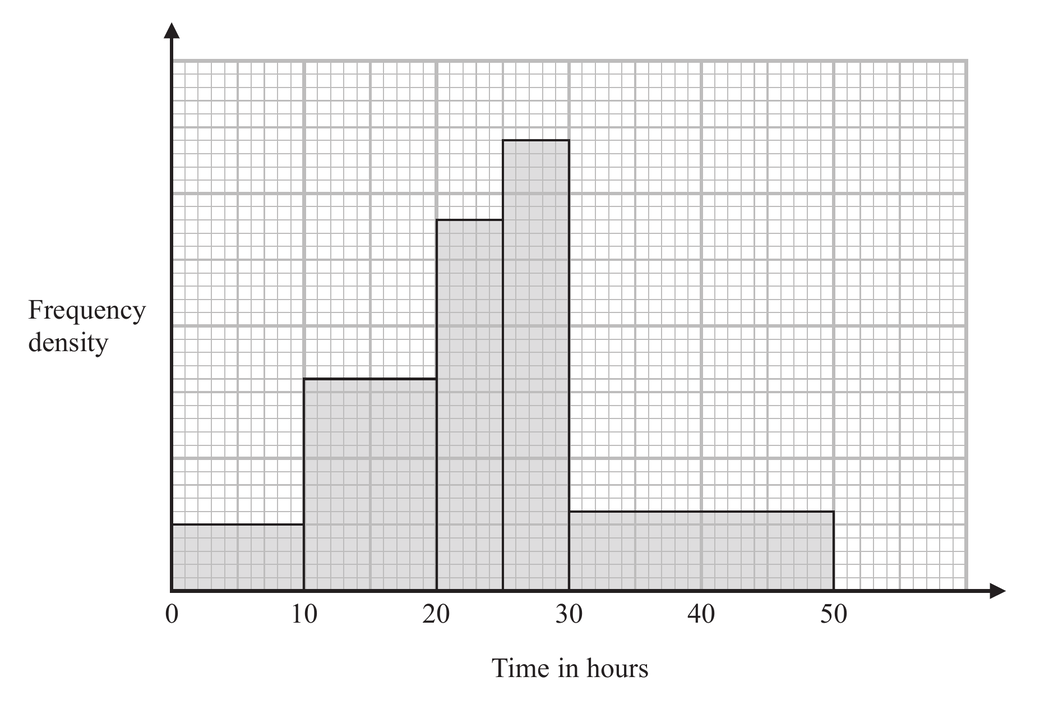
The histogram shows the number of hours worked in a given week by a group of freelance photographers.
(a) Give a reason to justify the use of a histogram to represent these data.
Given that of these freelance photographers spent between and hours working in this week,
(b) estimate the number that spent between and hours working in this week.
(c) Find an estimate for the median time spent working in this week by these freelance photographers.
Charlie decides to model these data using a normal distribution. Charlie calculates an estimate of the mean to be hours to one decimal place.
(d) Comment on Charlie’s decision to use a normal distribution. Give a justification for your answer.
题目中文翻译
直方图显示了一组 名自由摄影师在某一周内的工作时数。
(a) 说明使用直方图表示这些数据的一个理由。
已知其中 名自由摄影师在这一周工作了 到 小时,
(b) 估计这一周工作 到 小时的人数。
(c) 估计这 名自由摄影师在这一周工作时数的中位数。
Charlie 决定用正态分布对这些数据建模。他计算出的平均数估计值为 小时,精确到小数点后 位。
(d) 评论 Charlie 使用正态分布的决定,并说明理由。
解答
(a)
解法一
思路
展开
Histogram 适合连续型数据。这里的工作时间是连续变量,所以可以用 histogram 表示。
答题过程
展开
Time worked is continuous, so a histogram is suitable.
(b)
解法一
思路
展开
先用 到 小时这一组的频数 定出纵轴比例。然后从图上读出相应的频率密度,用面积表示频数。
题目要求 到 ,它横跨 到 以及 到 两组,所以要分两段算面积。
答题过程
展开
For the interval to hours,
Since the class width is , the frequency density is
From the histogram, the frequency in the interval to hours is .
Therefore the estimated number between and hours is
(c)
解法一
思路
展开
一共有 人,所以中位数位置取第 个数据。由 histogram 的面积可知,到 小时累计 人,到 小时累计 人,所以第 个在 到 这一组内。
在这一组内做线性插值。
答题过程
展开
The median is the nd value.
From the histogram, the cumulative frequency up to hours is , and the cumulative frequency up to hours is .
So the median lies in the interval to hours.
Using linear interpolation,
So the estimated median is
to decimal place.
解法二
思路
展开
也可以把中位数位置取为第 个数据,再在 到 小时这一组内插值。
答题过程
展开
Using the th value,
So the estimated median is
to decimal place.
(d)
解法一
思路
展开
正态分布是对称的,因此平均数和中位数应当接近。Charlie 的平均数是 ,上一小题估计的中位数也是约 ,所以这个决定是合理的。
答题过程
展开
Charlie’s decision is reasonable.
The estimated mean is hours and the estimated median is approximately hours. Since these are approximately equal, the data are consistent with a normal distribution.