
题目
A farmer supplies cabbages to a local supermarket. The supermarket manager takes a random sample of of these cabbages and the weight of each cabbage is recorded.
The weights of the cabbages in the sample are summarised in the following box plot.
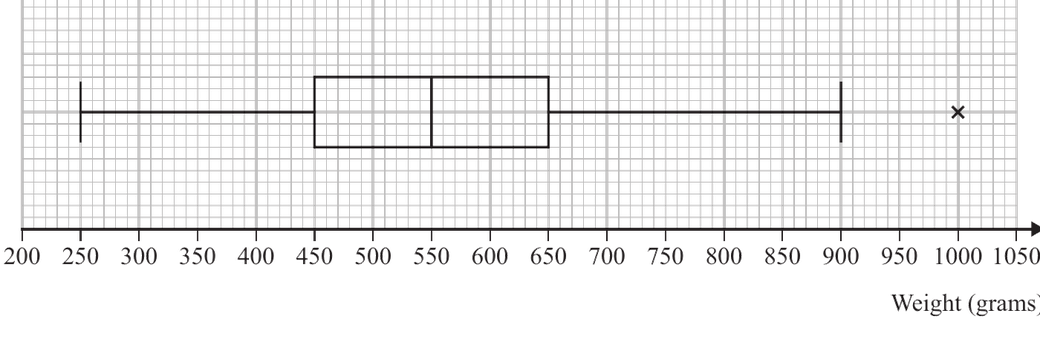
(a) Use linear interpolation to estimate the probability that a randomly chosen cabbage from this sample has a weight of less than grams.
The supermarket manager takes the quartiles from this sample and now decides to classify any cabbage whose weight is at least as extra-large.
(b) Find the minimum weight of a cabbage that the supermarket manager would classify as extra-large.
The supermarket manager assumes that the weights of cabbages supplied to the supermarket may be modelled by a normal distribution.
(c) Explain whether or not the box plot supports this assumption.
The farmer records the weight of every cabbage harvested from a field and classifies any cabbage whose weight is more than standard deviations above the mean as an outlier. Assuming that the weights of the cabbages from this field may be modelled by a normal distribution,
(d) find the probability that a randomly selected cabbage harvested from the field would be classified as an outlier using the farmer’s method.
The mean weight of the cabbages harvested from the field is grams. Given that a cabbage with a weight of grams is classified as an outlier by the farmer,
(e) find the maximum possible value of the standard deviation of the weights of cabbages harvested from the field.
解答
(a)
解法一
思路
展开
从 box plot 读出 median 是 , 是 。 位于 median 和 之间,这一段包含上四分之一的数据。用线性插值估计 在这一段中的比例。
答题过程
展开
From the box plot,
The probability below the median is , and the probability between and is .
Using linear interpolation between and ,
解法二
思路
展开
直观比例插值法。插值的本质是假设数据在区间内均匀分布。 从 Box plot 读出中位数 ,第三四分位数 。 以下的数据占 。而区间 的总长度为 ,该区间内包含总数据的 。 目标值 占该区间的比例为:
因此,该区间内小于 的数据占总数据的比例为:
最后加上中位数下方的 ,即可得到总概率。这种方法避开了套用复杂的插值代数公式,完全依赖对分位数百分比物理意义的直观理解。
答题过程
展开
From the box plot, the median is and the upper quartile is .
The data below accounts for of the distribution. The interval spans a width of grams and contains of the total data.
The position of within this interval is:
Thus, the proportion of data between and is:
The total probability of cabbages weighing less than grams is:
(b)
解法一
思路
展开
从 box plot 读出 、,所以四分位距是 。代入题目给出的 extra-large 边界。
答题过程
展开
From the box plot,
So
The minimum weight classified as extra-large is
(c)
解法一
思路
展开
Normal distribution 是对称的。box plot 看起来左右大致对称,尤其 到 median 和 median 到 距离相同,所以支持 normal model。
答题过程
展开
Yes, the box plot supports this assumption because it is reasonably symmetrical.
(d)
解法一
思路
展开
“More than standard deviations above the mean” 对应标准正态中的 。
答题过程
展开
For a normal distribution,
From the standard normal distribution,
(e)
解法一
思路
展开
Farmer 的 outlier 条件是重量超过 。已知平均数是 ,而 g 被归为 outlier,所以必须有
最大可能的 来自临界值。
答题过程
展开
For grams to be classified as an outlier,
So
Hence the maximum possible value of the standard deviation is